Runtime Debug Tools - Optimising for the Idiot Iteration Loop in Godot
Background
It’s been a while!
Like many people, I’ve recently been experimenting with Godot, as an alternative to more established engines like Unity. I’ll be writing up some thoughts on this in the future (in short, it’s very impressive), but for now I wanted to focus in on one of the specific challenges I hit coming from Unity – optimising for the Idiot Iteration Loop, and finding ways to improve the runtime debugging experience in Godot.
From this, I’ve also built the Godot Runtime Debug Tools add-on; a proof-of-concept that adds some features I wanted. Here’s a quick gif of it in action:
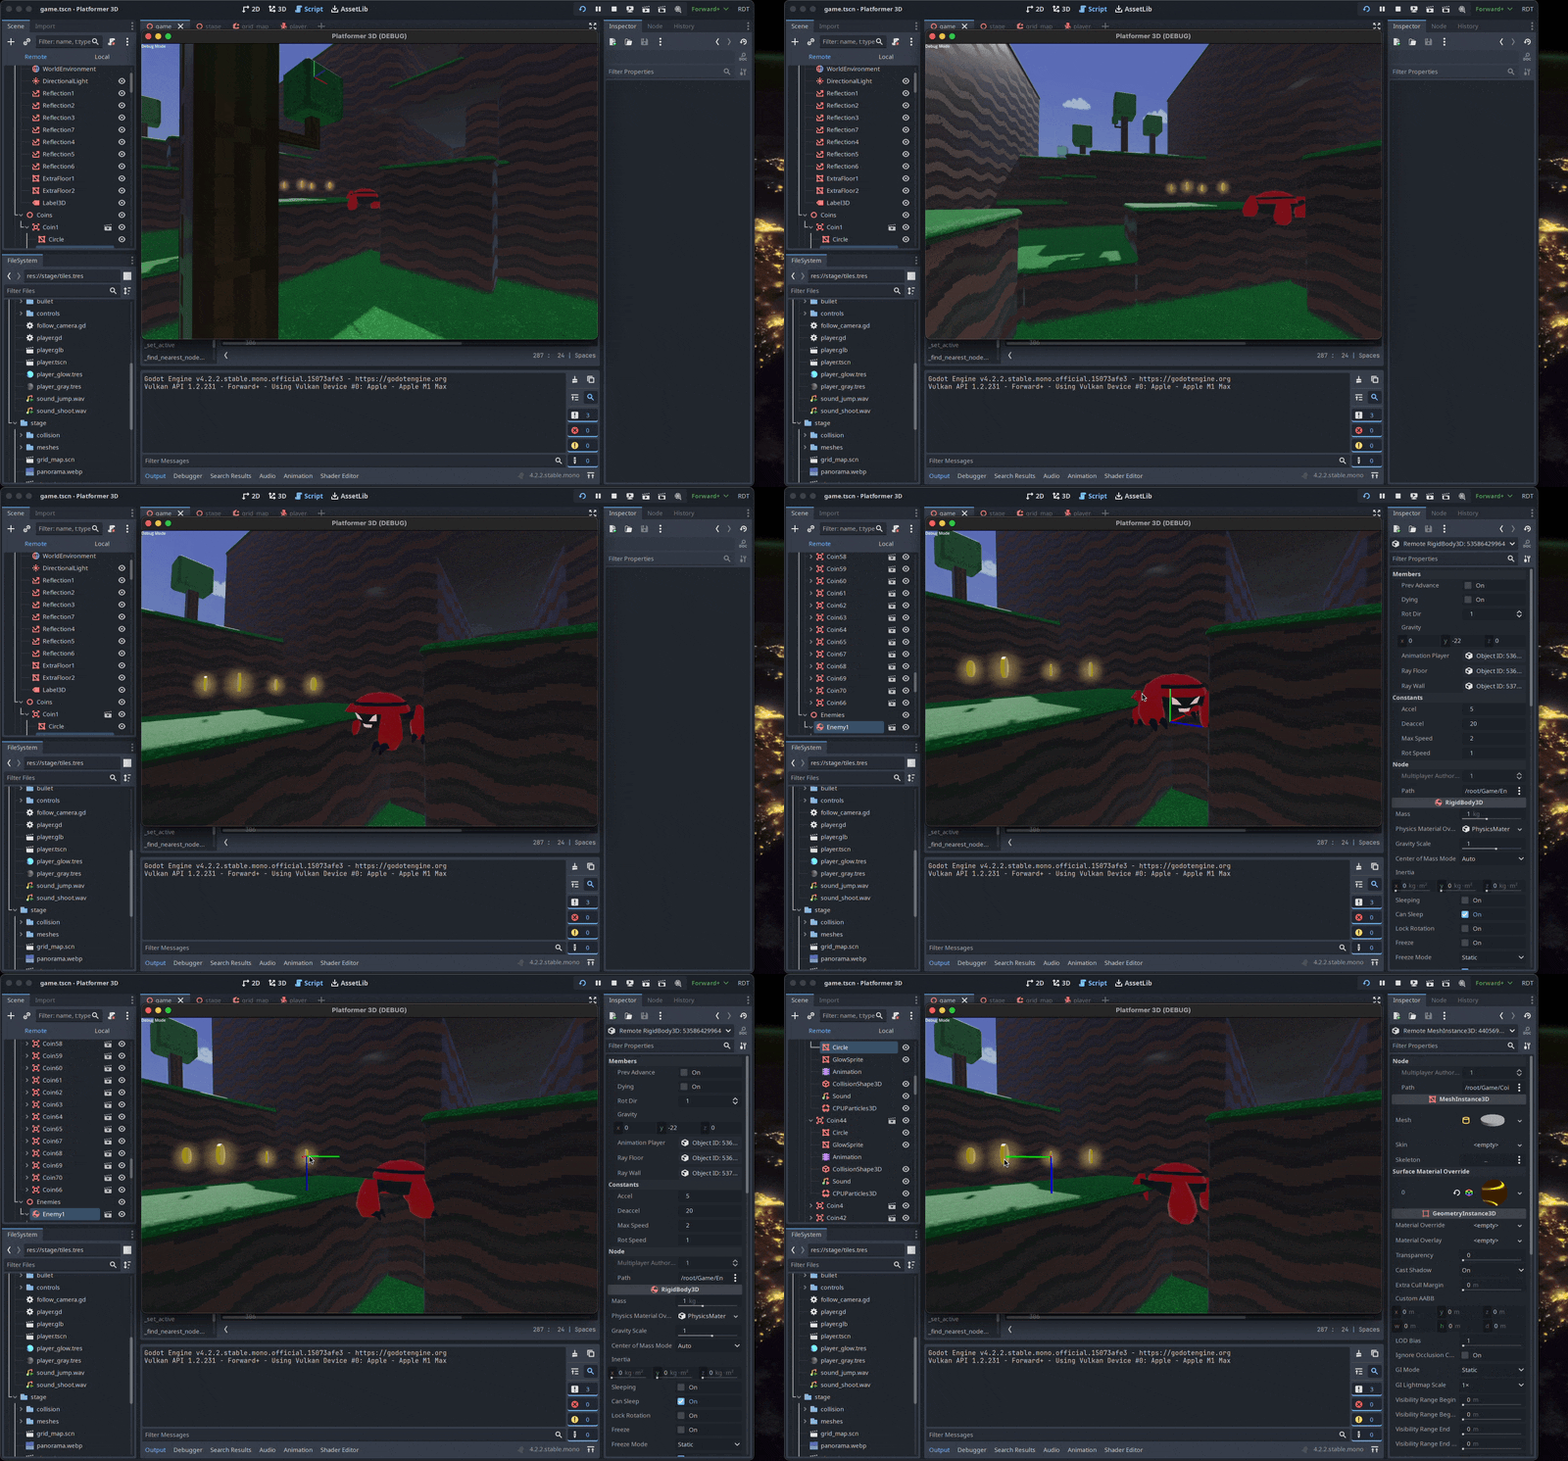
But first – an explanation.
The Unity Iteration Loop
For me, one of the killer features of Unity is the way it seamlessly blends the editing and the debugging tooling. When you play your game, the editor shifts from displaying the starting state of your game, and shows the runtime state of the game.
This means:
- You can view the running game in the Game view window – but it also shows in the 3D editor display, and the scene inspector.
- The editor view has its own camera for navigating with, which renders all the usual gizmos you can normally see in the editor – collision shapes, transform handles, etc.
- Clicking on an object in the scene inspector selects the object in the 3D editor view – and vice-versa.
- Dragging an object in the editor moves it in the game view.
- Values displayed in the object inspector are ‘live’, and editable.
This creates a wonderfully interactive workflow where you very often don’t need to use a debugger – the Unity editor is the debugger.
The Idiot Iteration Loop
Examples of where this is useful:
- “Why is that object falling through the floor?
Oh, it doesn’t have a collider assigned, I’m an idiot.” - “What on earth is that in the middle of of the camera view? <click in 3D view> Oh, what the hell? Oh, god, that shouldn’t be a rigidbody, I really am an idiot.”
- “That jump height is ridiculous. What’s it set to?
. 10 meters a second – what were you thinking, you fool? Let’s try 0.5. . Too low. 1? Ah much better.” - “Why aren’t the evil nasties attacking me? <click in 3D view, look in object inspector>. They’re still in state ‘waiting’ – but they should be able to see me? Let me check the raycast layer. <look in the entity’s components>. Oh Christ on a bike, how do I do this every time.”
I call this the Idiot Iteration Loop because:
- I am an idiot, and game development is hard.
- Finding out exactly how I’ve been an idiot, quickly, is important to both my workflow and my fragile ego.
- My development process is thus iteratively fumbling my way through my idiocy, towards success.
Good runtime debugging tools are crucial to this fumbling.
The Godot Iteration Loop
The overall Godot iteration experience is somewhat different to Unity’s. In many ways it’s better:
- Your game starts and exits extremely quickly, which makes overall iterations very quick.
- GDScript hot reloads when you make changes – and the hot reloading actually works.
- There’s an excellent built-in code debugger (if you’re using GDScript).
- There’s a code editor for making quick changes while debugging.
- You get a variety of good debugging tools built in. – a serviceable remote scene tree, which shows the the live state of the game in an inspector; and a remote camera override which allows you to control the location of the game camera from the editor.
These are great – but, for my workflow, there are various things that I missed from Unity.
Viewing spawned/moving objects in the editor
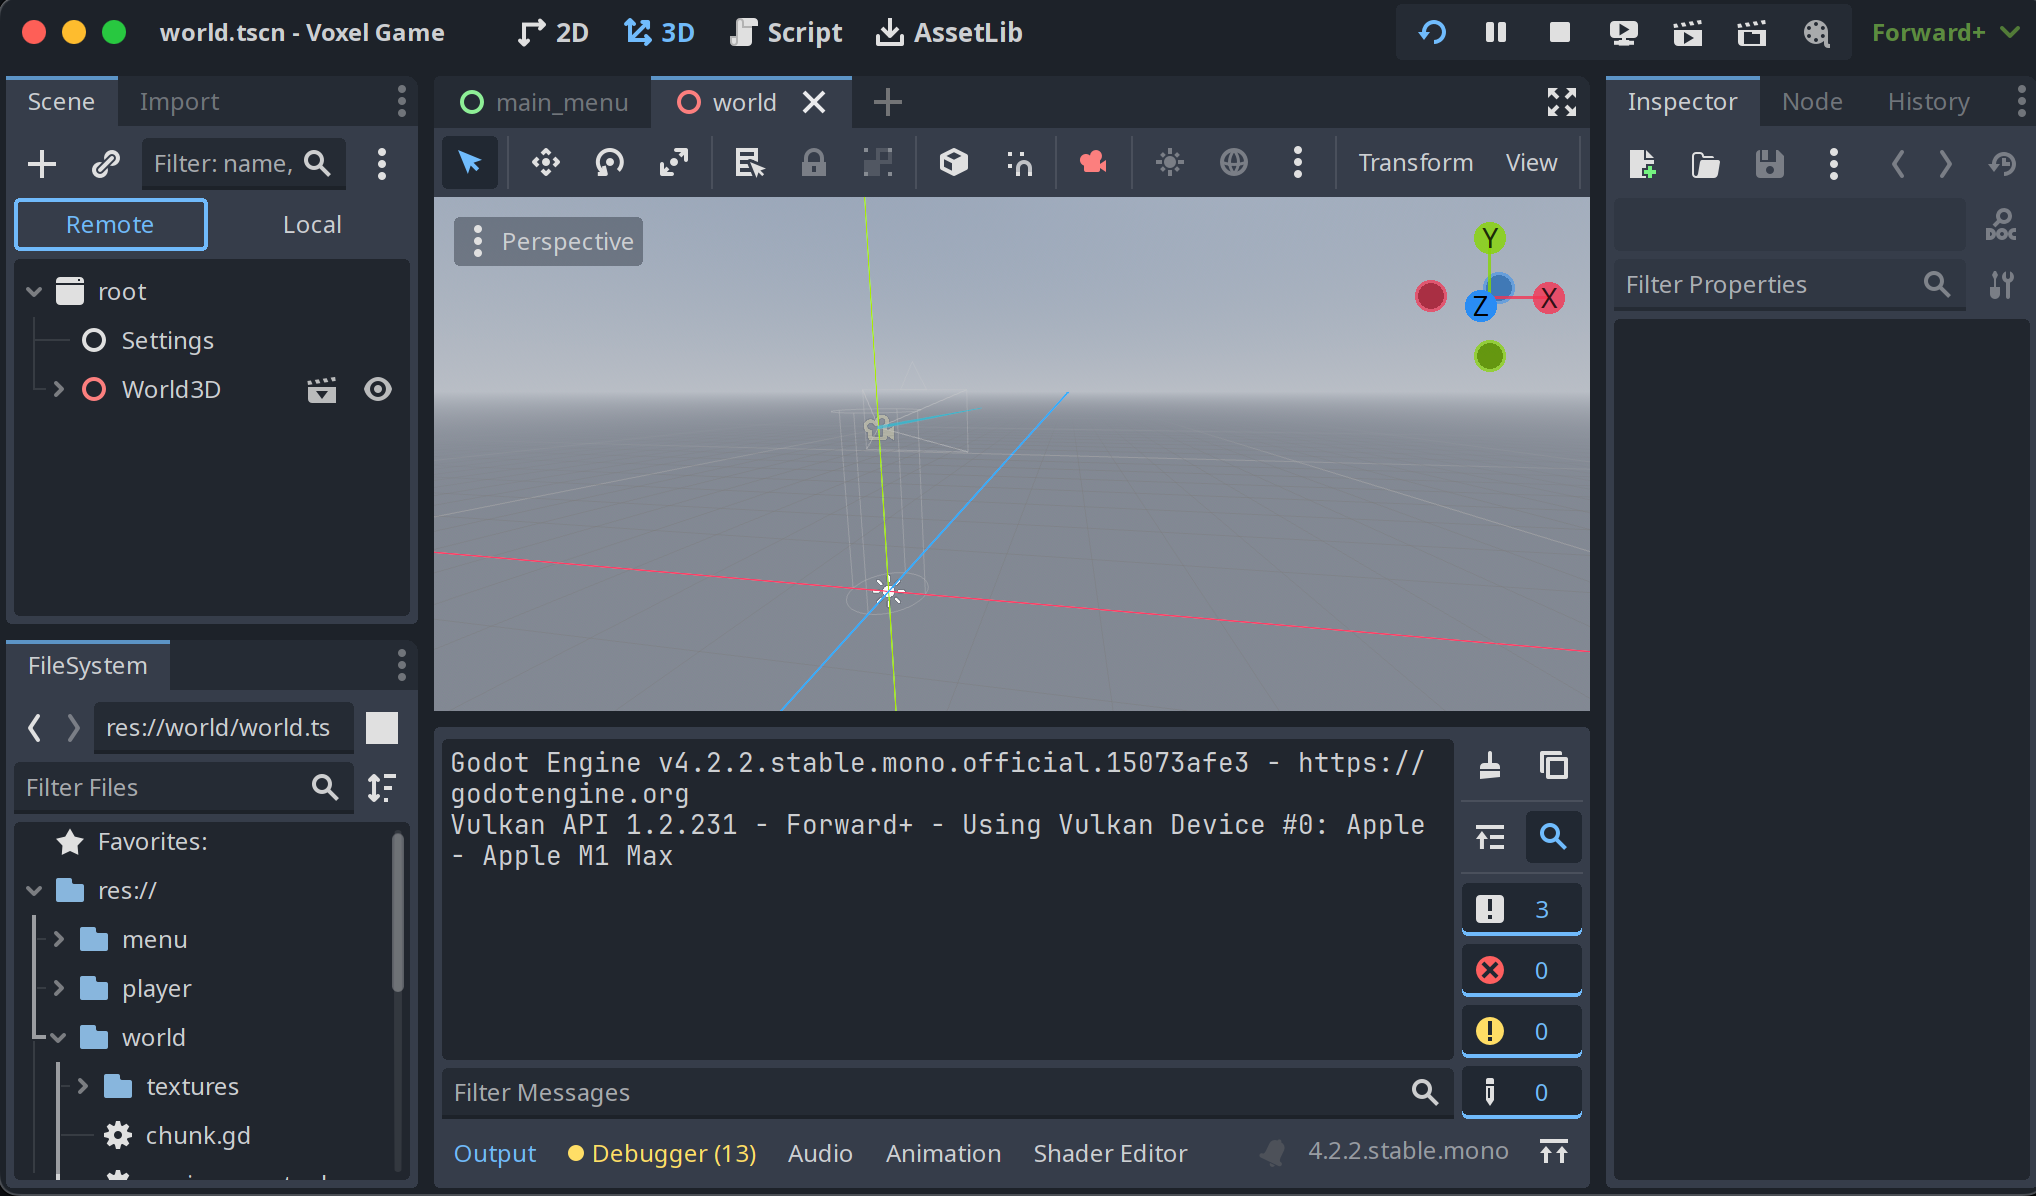
Firstly, and most obviously, in Godot there’s no ‘editor’ view of the running scene. You can see the starting point of your scene, but any object movements or spawns in the running game are not visible in the editor.
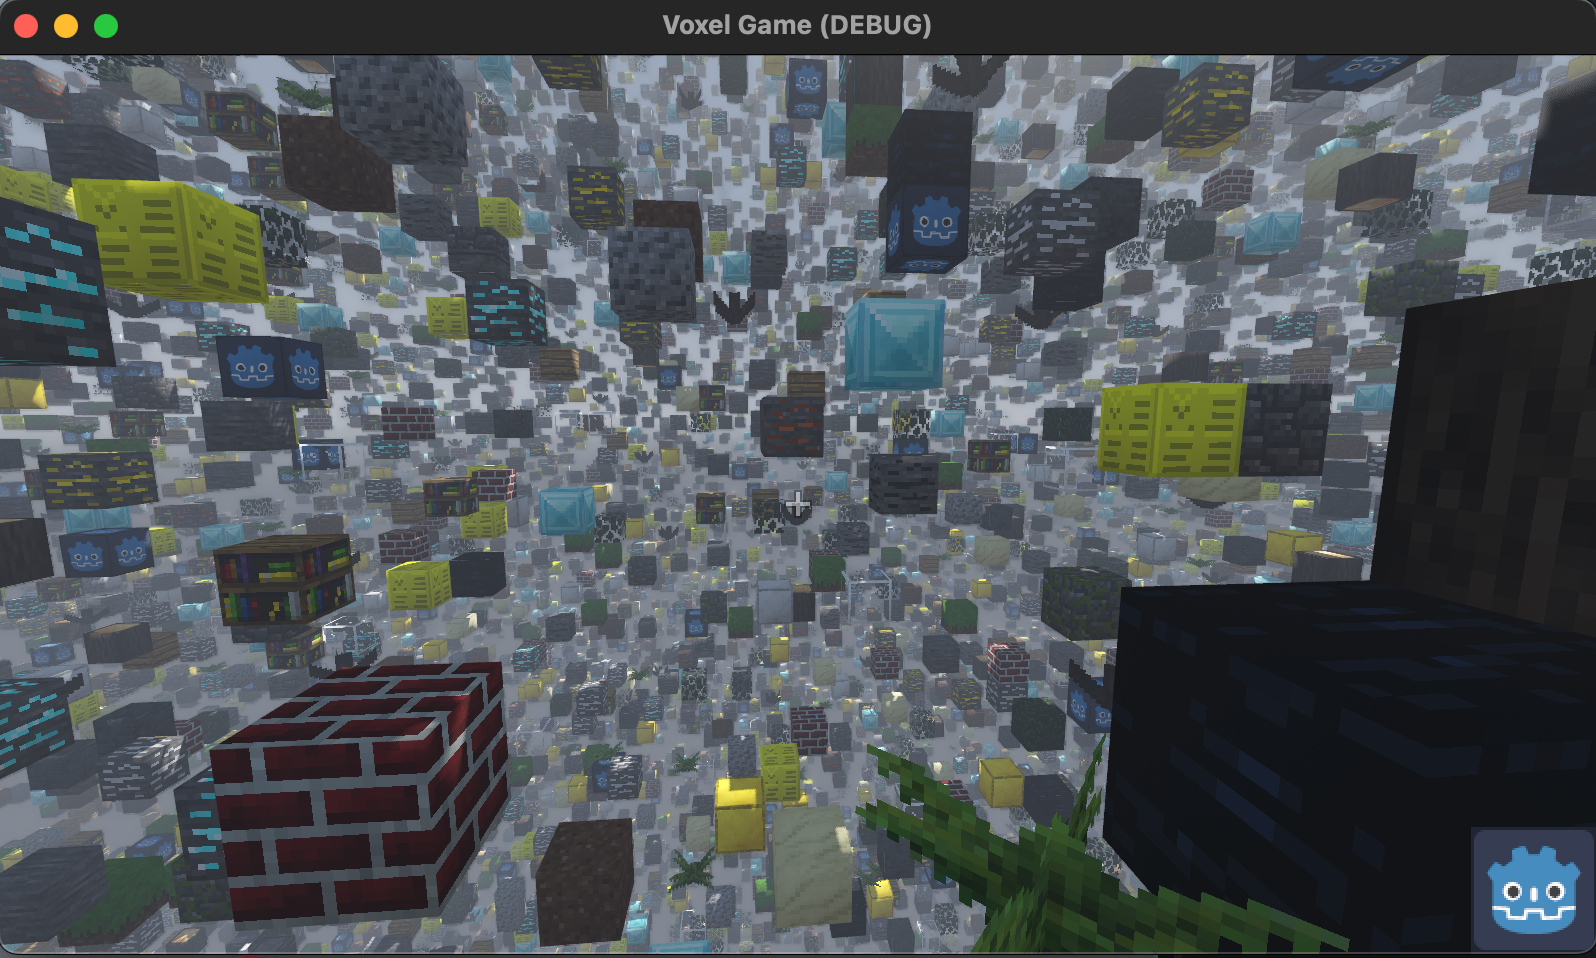
This might seem like a small thing, particularly if you’re working with mostly static scenes, but in my experience it’s usually the things that change at runtime that need debugging. It’s particularly challenging in games with a lot of dynamic content, with procedural generation being an extreme case.
To give an example below, on the left is game view of the ‘Voxel Game’ Godot demo project running, and on the right is the editor view.
| Voxel Game Running | Voxel Game in the editor |
|---|---|
 |
 |
Camera control and selecting objects
While you can’t view the running scene in the editor, you can take control of the runtime camera in the editor, using ‘remote camera override. This means you can use the editor to move around in your game. This is useful, but can often be be weird – you’re moving the mouse in one window, while looking at another; and because the editor doesn’t show runtime changes, the two windows may show very different things.
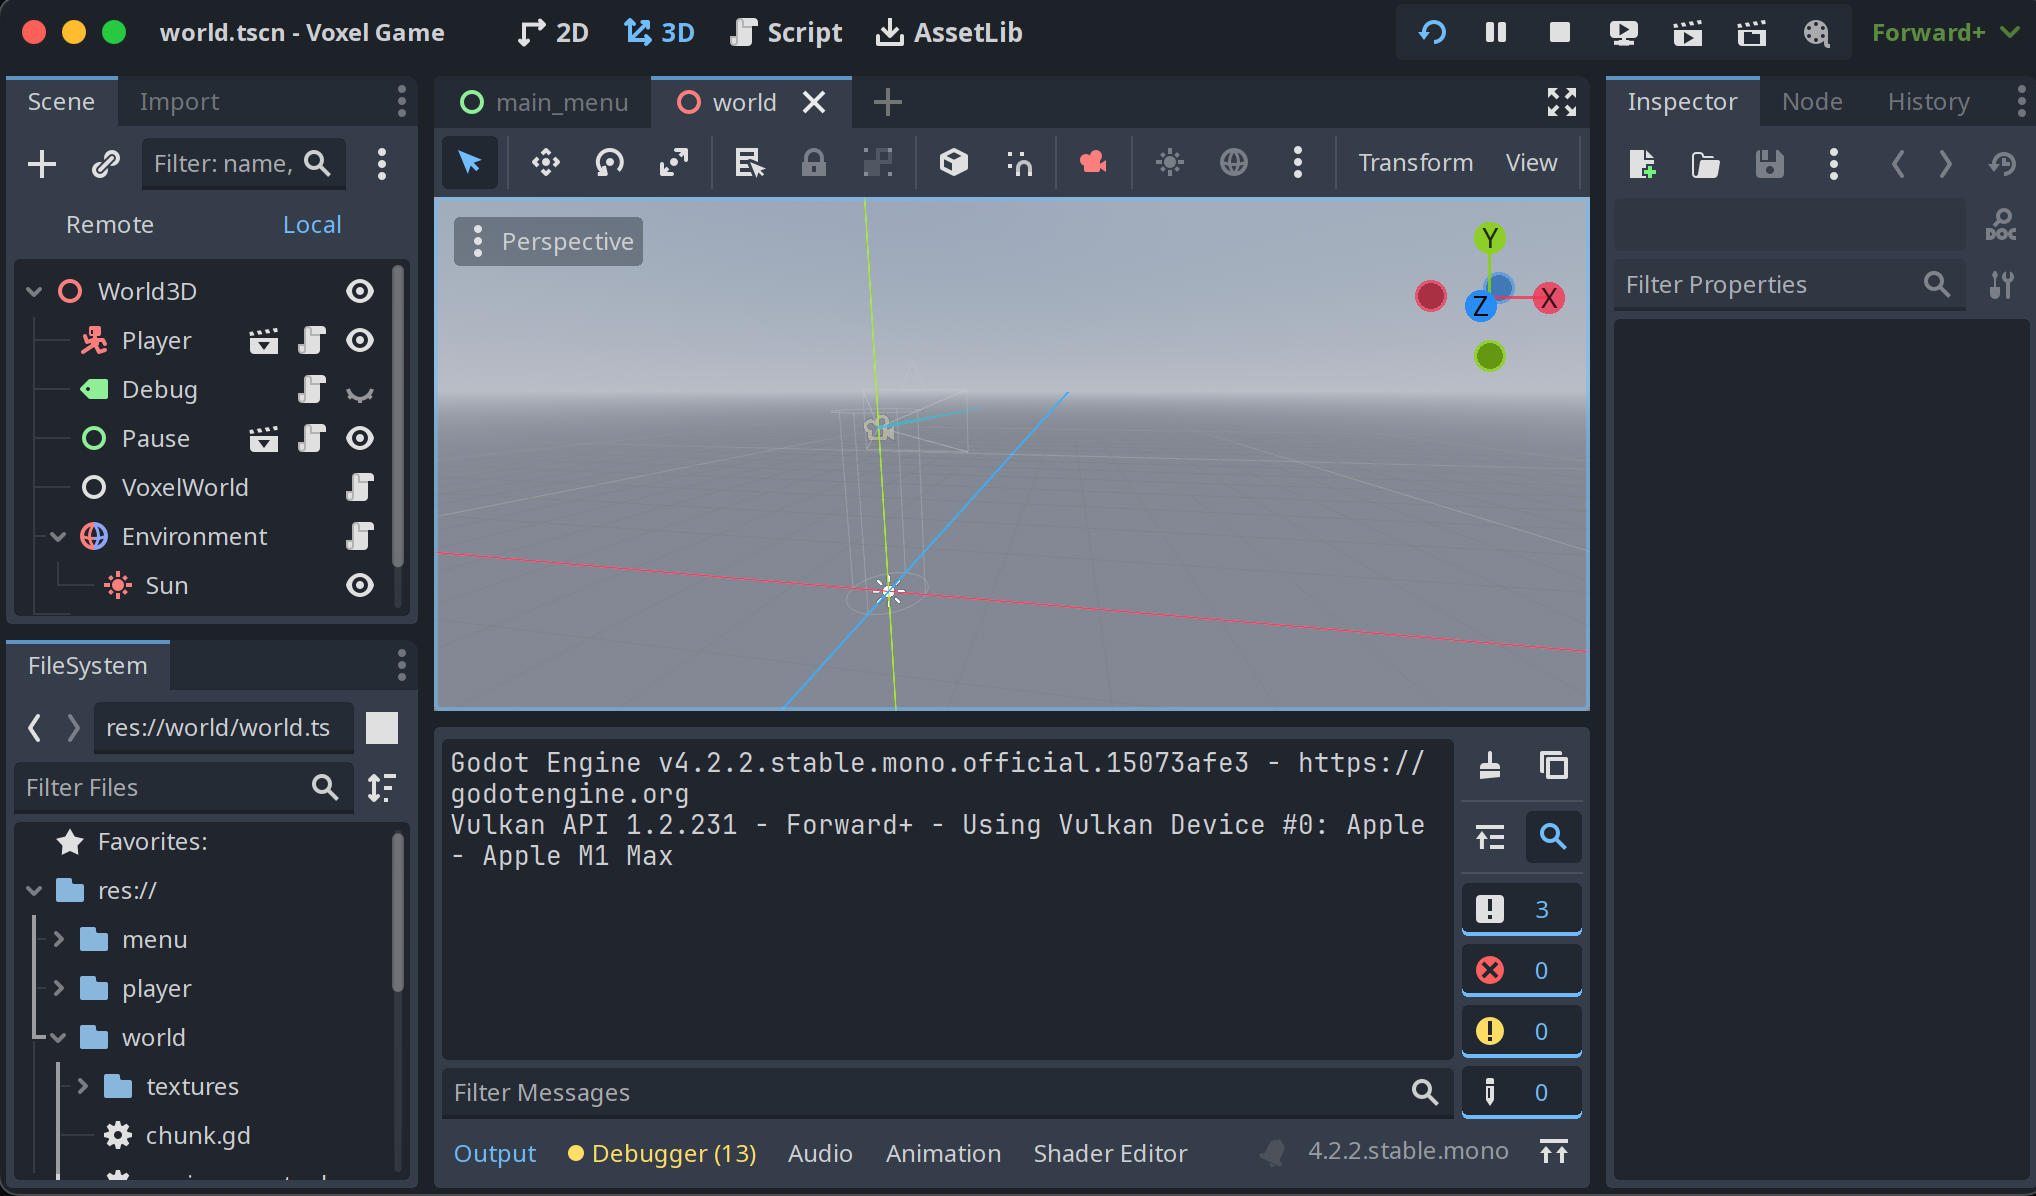
More importantly, there’s no way to easily select things that have moved/spawned; you can’t click in the game, and the editor doesn’t show them; the only option is to try and find them in the inspector.
Using the Voxel example above – if you want to select one of those cubes to debug it, you may need some patience navigating the scene tree on the left:
Debug Visualisations
Godot has some great visualisations built in, for things like collision meshes, navigation, etc. However, you usually have to turn these on before you run the game, which is annoying if you find yourself debugging something unexpected.
There are also a whole host of runtime debug visualisation options. These are great – but need be enabled in code.
Ideally, you’d be able to turn these things on at any point. (Maybe you can and I’ve missed it).
The Challenge
Barriers to closing the gap
Fundamentally, most of these differences in runtime experience come down to different architectural choices Unity and Godot have made.
Unity runs your game code within the Editor process itself. This means it has full access to everything in your running game – object data, textures, meshes – and can do anything it likes with them, including rendering them efficiently.
Godot takes a different approach. It runs the game as an entirely separate process, and any communication between the two happens over a network connection. This clear separation has many advantages – it makes things fast and robust, and is significantly simpler to implement – but it also limits what the editor is able to do with runtime state. The obvious example is that rendering meshes and textures that exist in another process, quickly, is hard.
It’s this key difference that makes closing the gap between the Idiot Iteration Loop in Godot and Unity challenging. Godot has narrowed the gap significantly over the years – the remote tree inspector and remote camera override are major improvements – and there are various proposals to close the gap further. But the fundamental challenge remains.
Working within the constraints
Importantly, these constraints aren’t unique to Godot. Outside of Unity, most game engines have a clear separation between ‘authoring tools’ and ‘developer/debugging tools’. Historically game developers have often ended up implementing a rich suite of debugging tools into the games runtimes, entirely separate from the authoring tools. This is why tools like Dear ImGUI are so popular with developers for quickly trying to knock up in-game developer tooling.
And with Godot, there’s no reason we can’t do something similar. Or indeed, even better, since Godot provides any easy to use API for sending data between the game and the editor, which opens up more opportunities. So, rather than trying to solve the (hard!) problem of getting the editor to render things that only exist in the game process; can we push enough debug functionality into the runtime, and then use the editor to drive that?
There are various addons and snippets where people have been doing this, including:
- The DebugCamera addon for controlling an in-game camera.
- Runtime Node Selector for selecting nodes in the editor from the game.
- A clever bodge for toggling collision shapes at runtime.
- A Solution – Godot Runtime Debug Tools
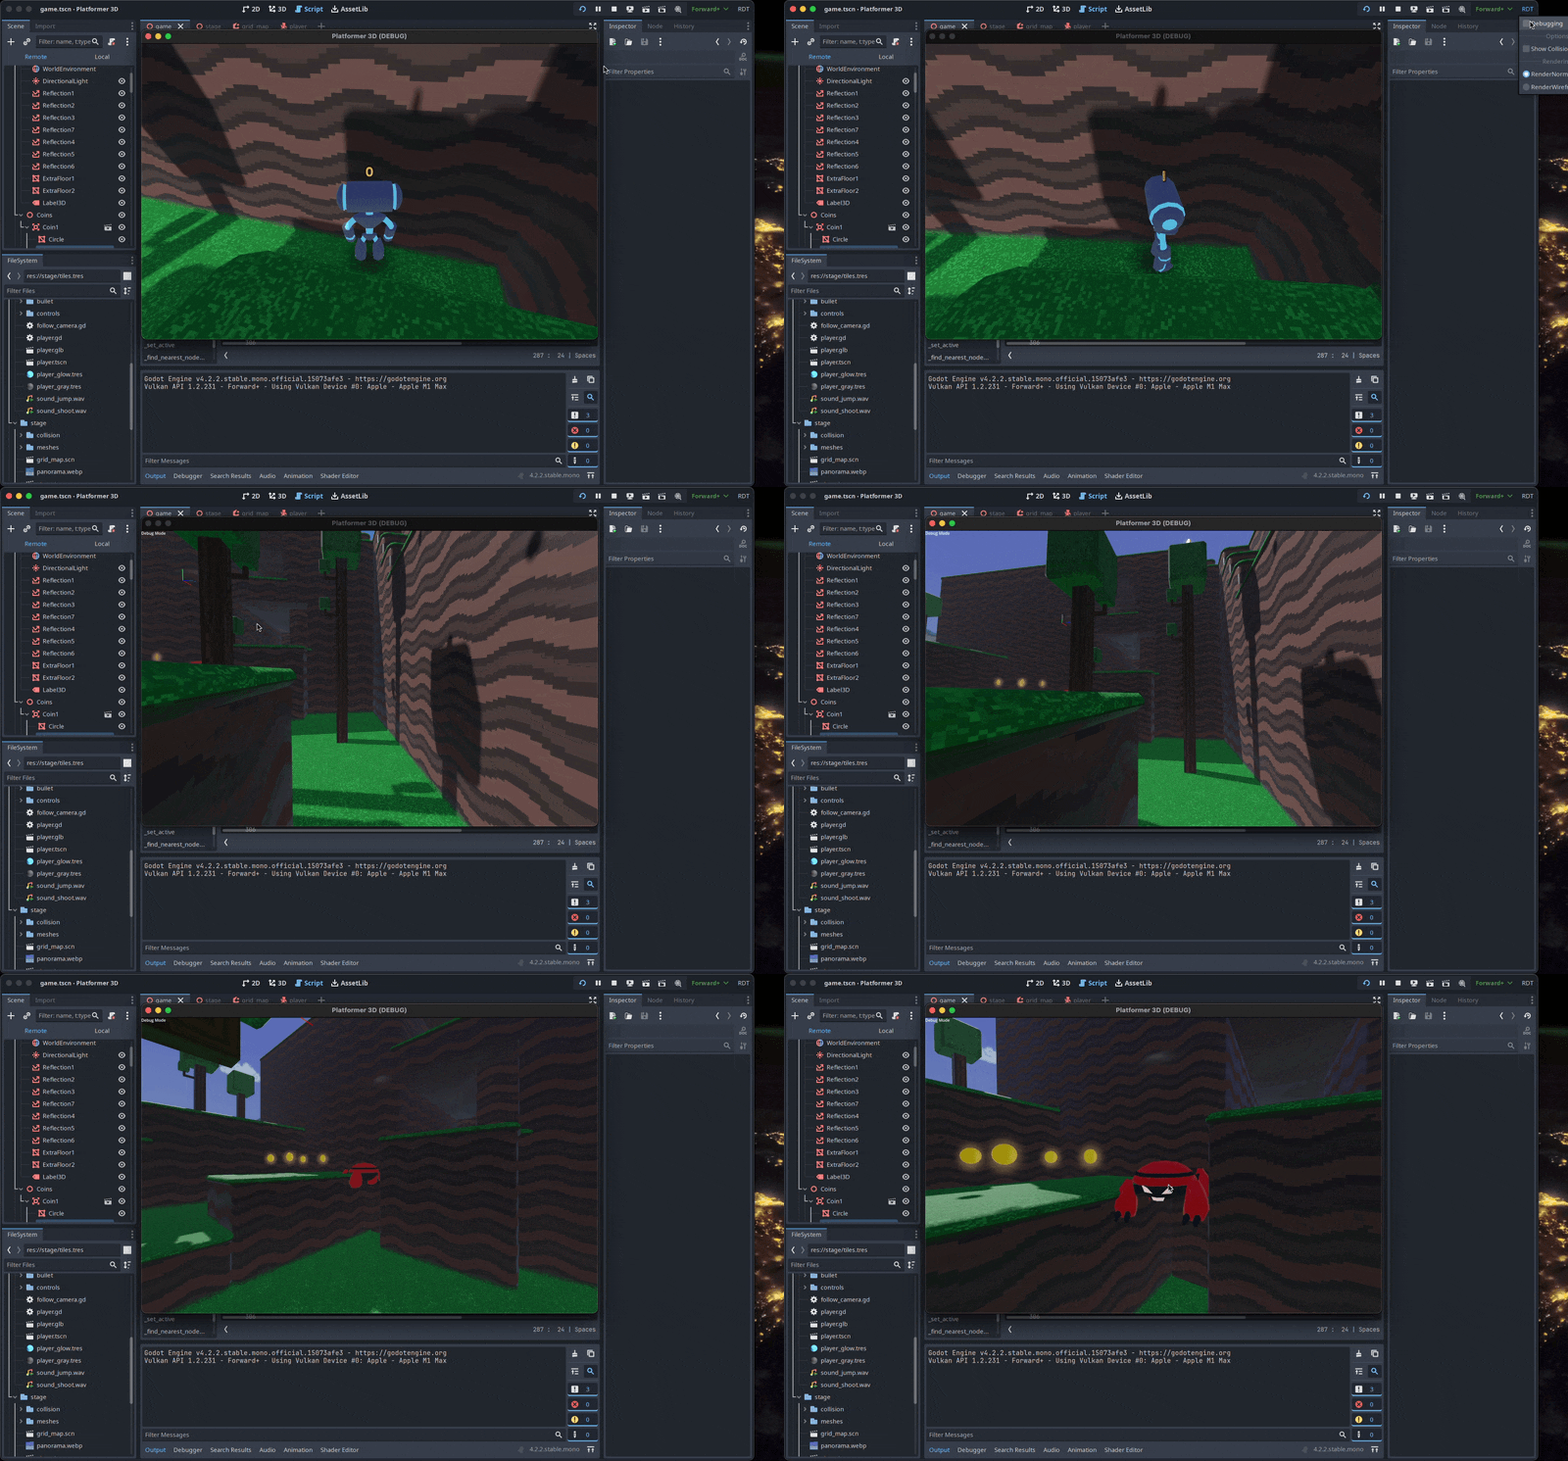
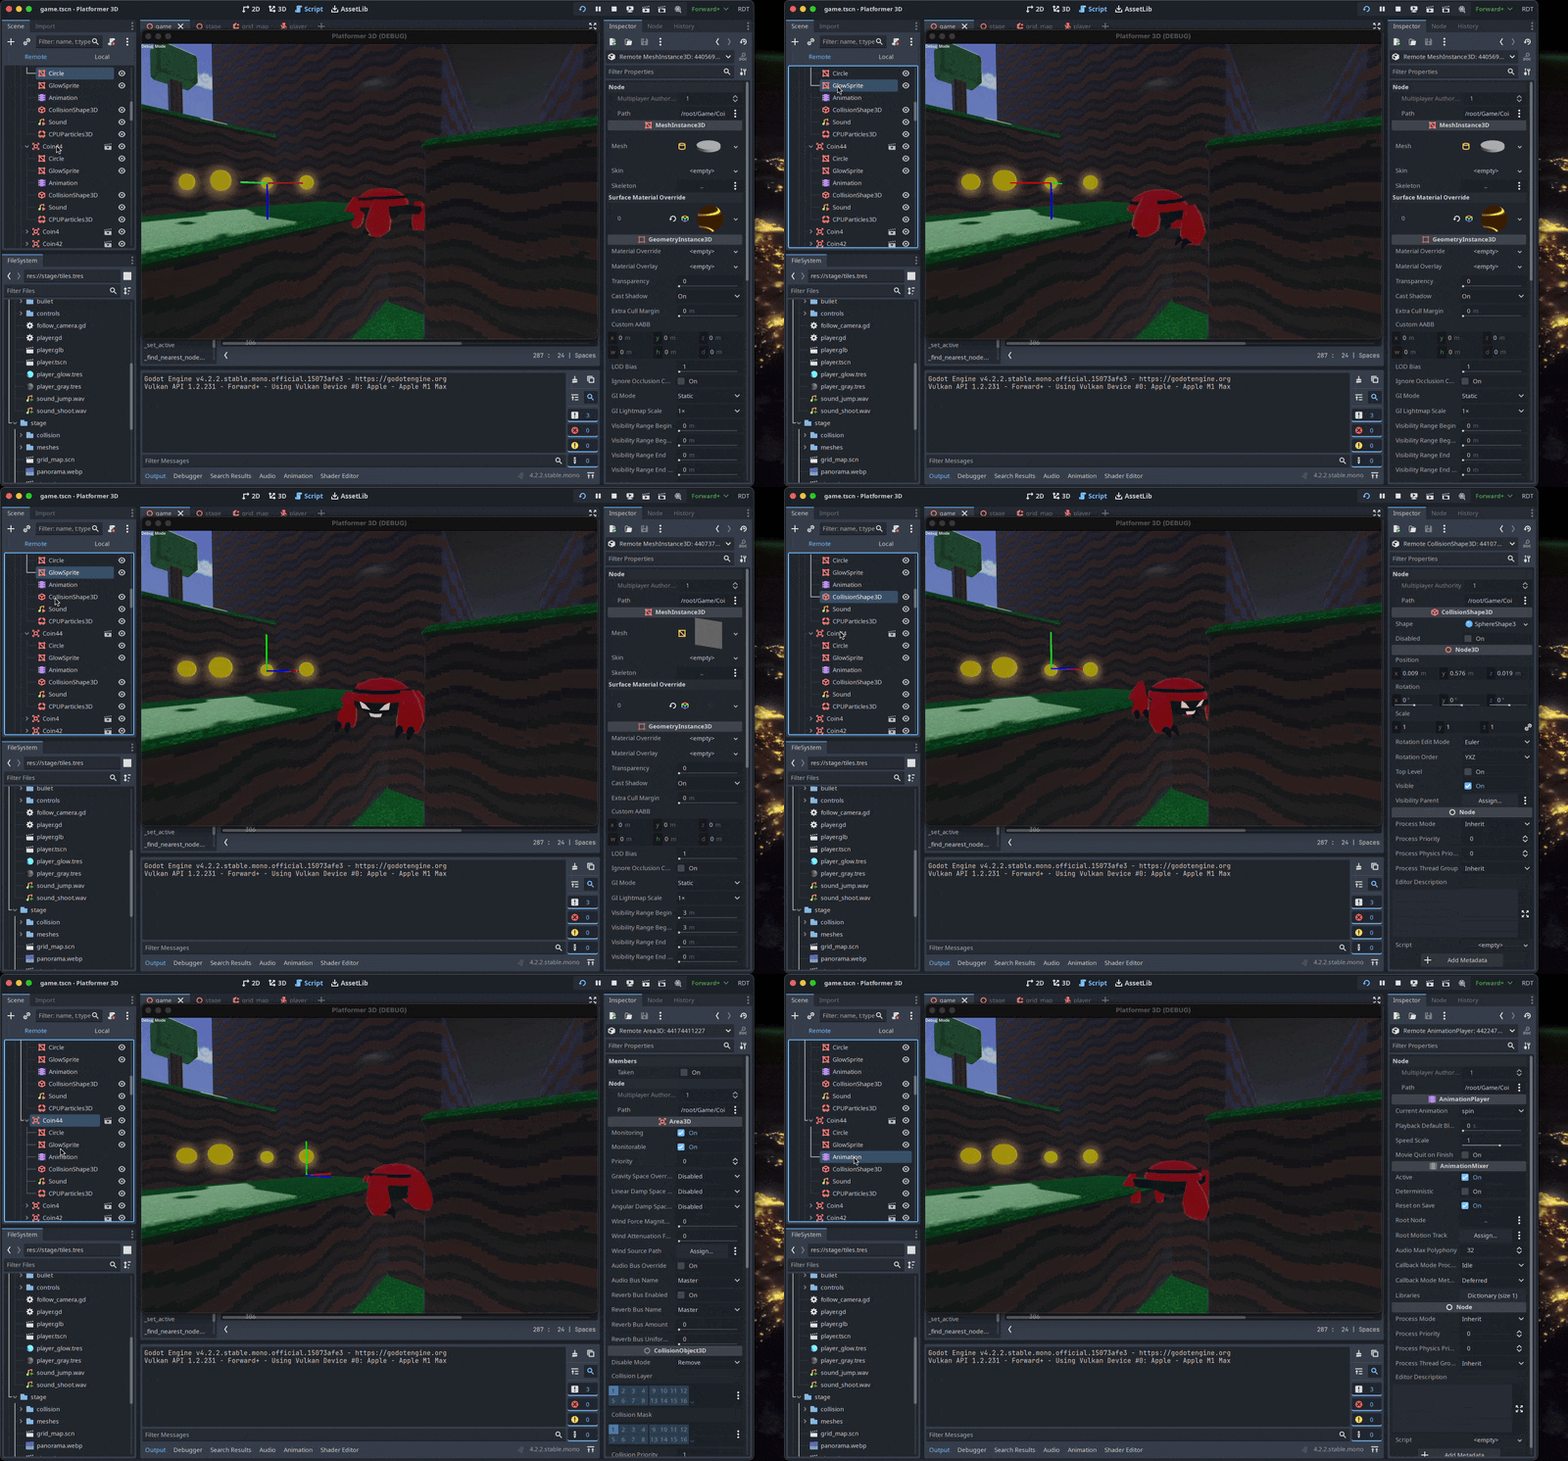
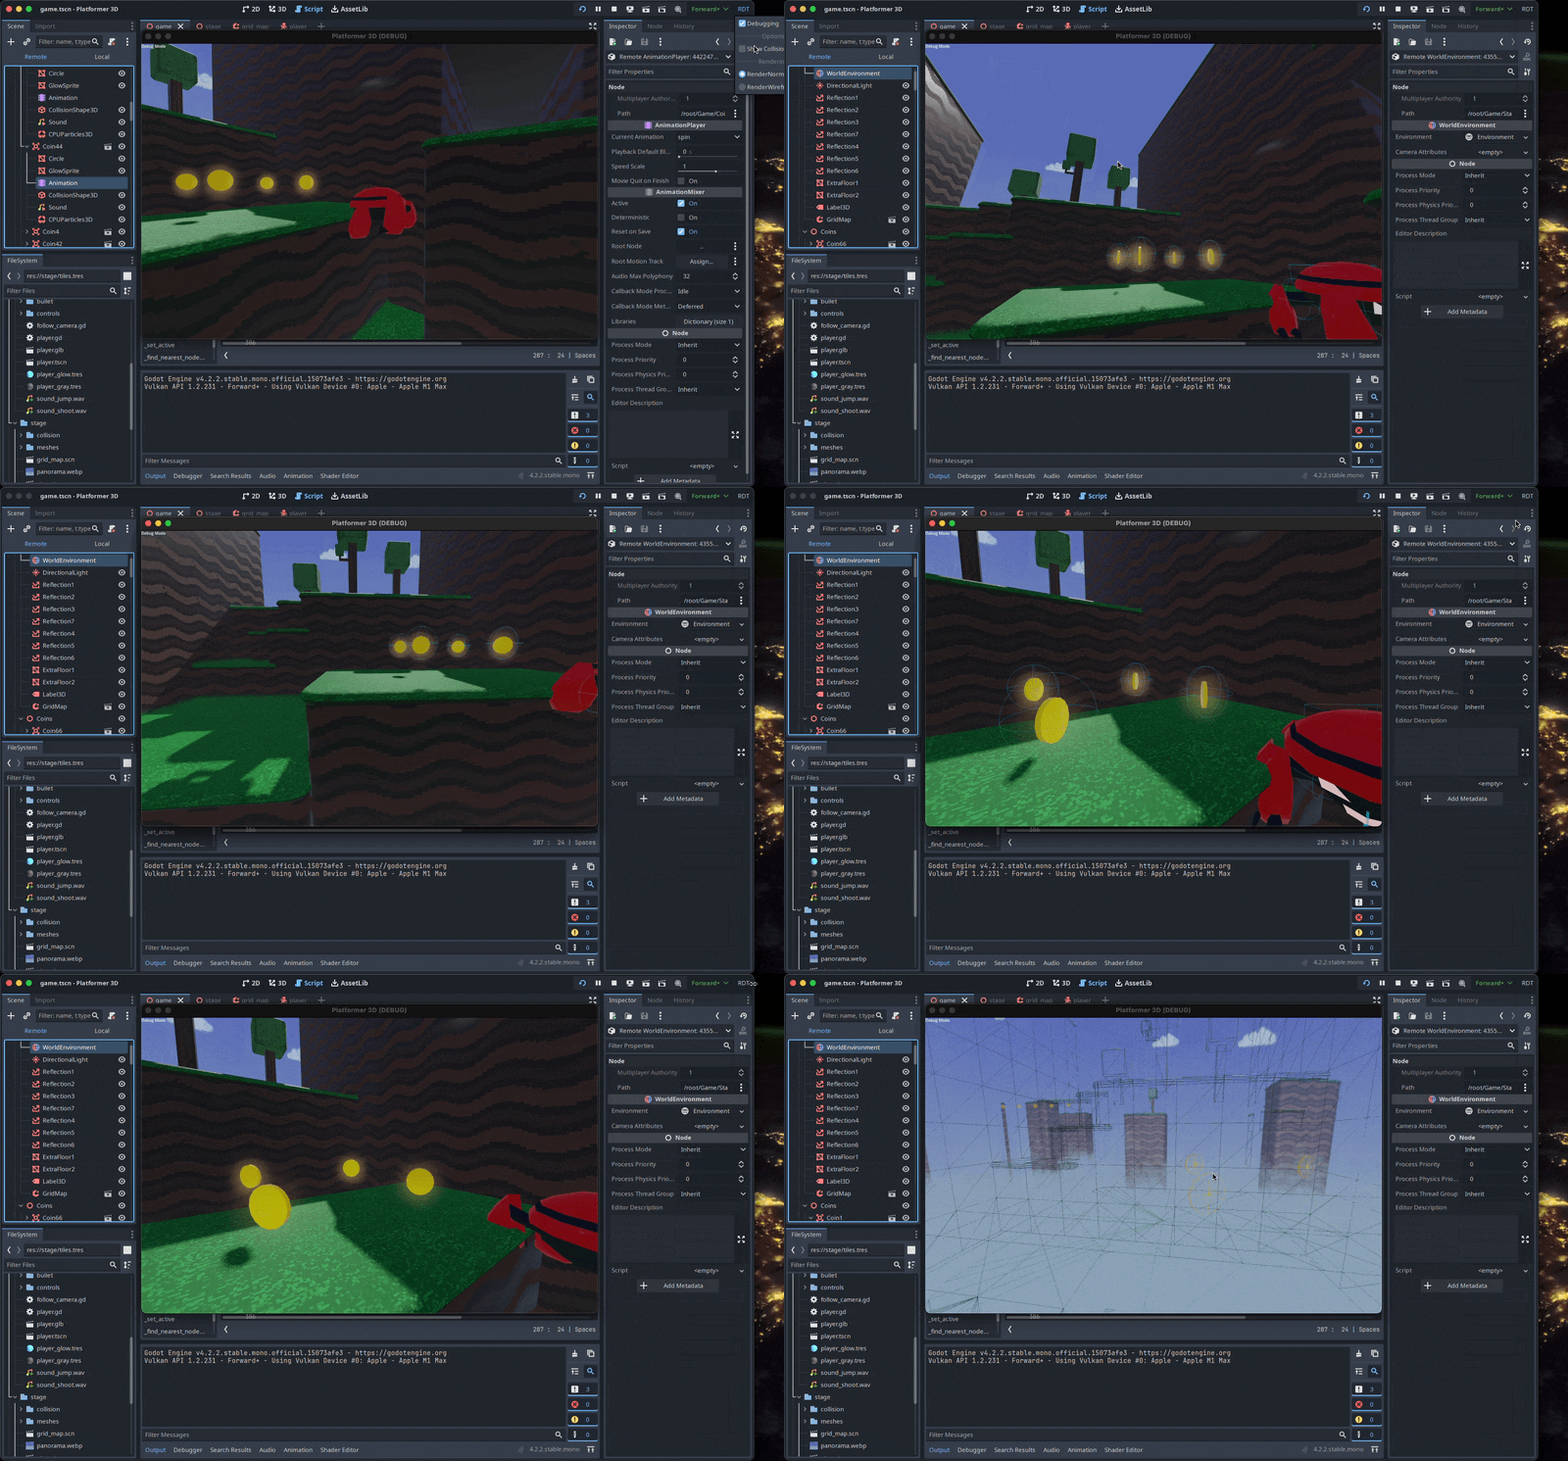
Inspired by these, I’ve written a small proof-of-concept add-on for Godot, to see if I can get closer to the Idiot Iteration Loop I want – it’s called Godot Runtime Debug Tools (boring, but searchable), and has several key features:
| Debug Camera with editor controls | In-game object selection synced with the editor |
|---|---|
 |
 |
| Editor object selection showing in game | Runtime toggling of debug visualisations |
|---|---|
 |
 |
-
Debug Camera with editor controls
-
In-game object selection synced with the editor tree view.
-
Editor object selection shows up in game
Runtime toggling of debug visualisations
Conclusion
Godot Runtime Debug Tools is largely intended as a proof-of-concept for an approach that improves on the runtime debugging experience, working within the constraints and capabilities of Godot’s architecture. For me, just being able to fly around and click on things and see them in the editor allows me to spend less time in my Idiot State.
I hope someone else finds it useful as well!
- ← Previous
UberLogger - Redux - Next →
Runtime Debug Tools Update